How to Build a Personalized Trading Dashboard?
A personalized dashboard to viusalize trading actions and stock development


Update 11-May: The web app is now deployed on streamlit. Please check it out and let me know how it works.
TL;NR: if you are mainly interested in the codes, here is the link to GitHub
Motivation
Yesterday I came across an article The Boredom Economy. Sydney Ember explained the GameStop phenomenon as investors' reaction to the boredom experienced during the pandemic.
Being one amateur day traders new to the market, I fully concur with the explanation Sydney put forth. I noticed myself spending hours daily analyzing the market and trading frequently for profits, as an escape from boredom. Resultantly, I I generated an amount of data in 2020 that could pertentially be used for a study on my 'trading style'.
With this in mind, I decided started a project on analysing my trading activities. To start with, I create a dashboard to visualize the activities, to understand how and when I tend to buy/sell a stock.
Preparation
My primary trading platform is Trading212. The platform recently included a new feature that allows exporting transaction history in csv format. The exported data is clean neatly structured, which is ready for analysis.
For the tools, I noticed a repo on GitHub panel-altair-dashboard that creates a simple, yet powerful, visualization tool (dashboard) in roughly 25 lines of codes. It is achieved by with Panel and Altair.
To achieve visualizing my trading activities, I include the following features:
- mark transaction actions (sell or buy), in the stock time history
- plot the stock historical data using candlestick
Time to visualize the time series!
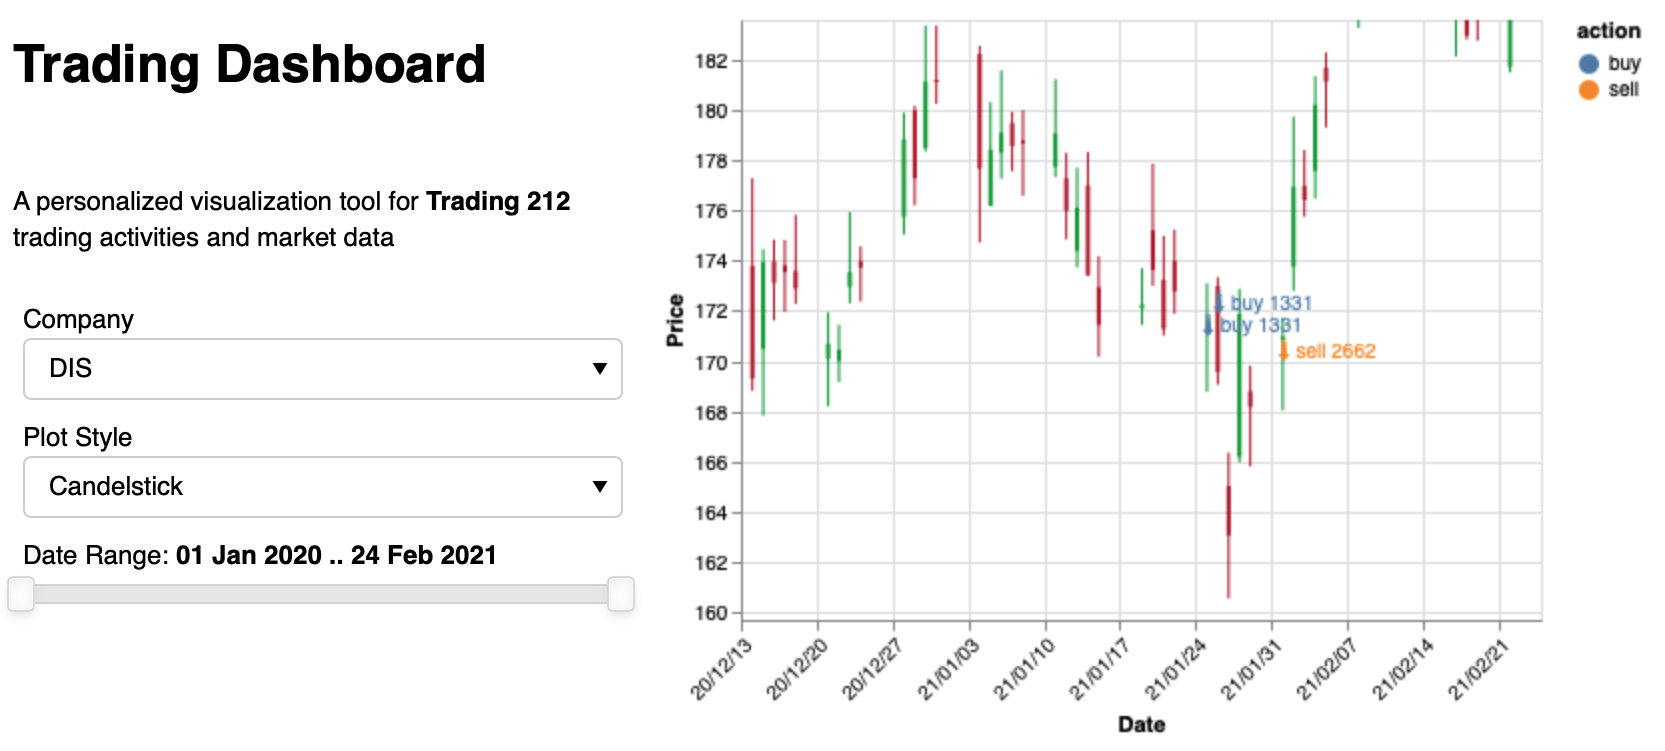
Below is a screenshot of the dashboard. In it, the transaction data (buy or sell)is visualzied along with the market data. There is an option to visualize the market data in either line plot or candlestick, depending on whether you are interested in long term trends or the variations within the day. For a demo, please refer to binder.
It is still at the very early stage of development. In the future, I would like to add the following,
- provide a summary of my portfolio
- normalize the stock price for the selected during
And more features will be inlcuded, if I find anything interesting!