How Did Road Freight Transport Develop in the Netherlands?
An exploratory data analysis of Freight transport in the Netherland
I spent hours daily driving on one of the busiest motorways in the Netherlands when commuting was still a norm. When I first came across with the goods vehicle data on CBS website, it immediately attracted my attention: it could answer those not so important questions that I have always had, when stuck in a traffic jam after a long day of work, alongside the lorries.
In this article, we will explore several aspects of goods vehicles transportation in particular,
-
What are the types of common goods vehicles? How can we tell them apart using data?
-
What is the lifespan of a goods vehicle?
-
Why is there such a high volume of goods vehicles on the motorways nowadays?
General information
As described on CBS website, the data provides information
… on total vehicle kilometres of goods vehicles in the Netherlands (broken down by Dutch and foreign vehicles) and data of total kilometres and average annual kilometres of Dutch goods vehicles (broken down by Dutch and foreign territory). All figures are further broken down by lorries and road tractors, by age of the vehicle and by load capacity.
In the analysis, we will answer the question using mainly the following:
-
country of origin: Dutch or foreign vehicles
-
vehicle type: lorries or road tractors
-
vehicle age: deducted from the year of construction
-
vehicle km territory: abroad or in the Netherlands
Goods vehicle type
The original dataset breaks the goods vehicle into several groups and subgroups. For simplicity concerns, we will treat them as either lorry or road tractor.
 Amount of Dutch goods vehicles in use, from 2001 to 2018
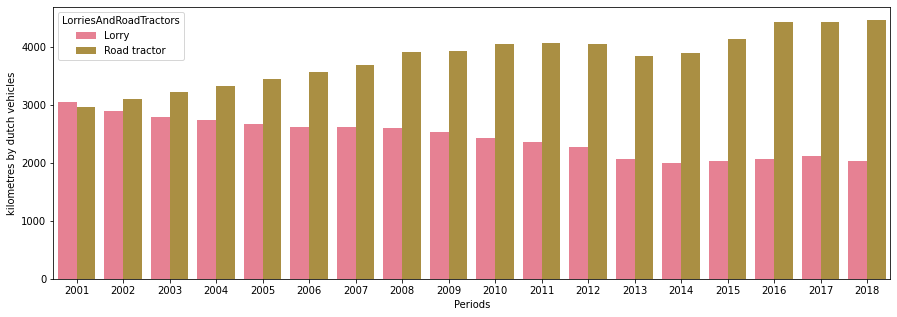 Kilometres by different vehicles types, from 2001 to 2018
From the charts above, it can be concluded that road tractor is gradually gaining popularity as of 2001. Road tractor total kilometres outnumber lorries in 2002. The registered amount of road tractor outnumbered lorries in 2008. In 2018, road tractor kilometres was already more than twice that of the lorry.
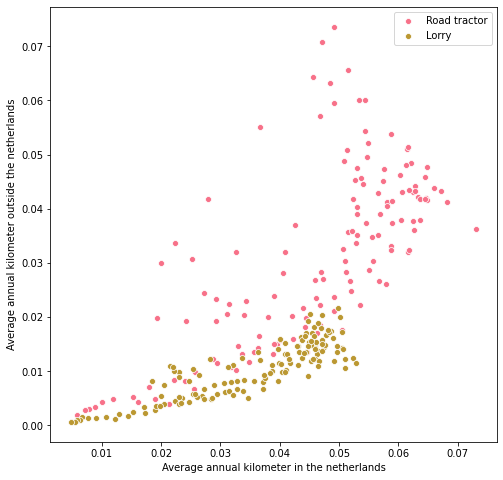
What about the annual average? The figure above compares the average annual kilometres in and outside the Netherlands, for lorries and road tractors. From the figure above, it is observed that:
-
Road tractors are more involved in extra-territory transportation than lorries;
-
Road tractors tend to have larger annual kilometres than the lorries, both in and outside the Netherlands.
The lifespan of goods vehicle
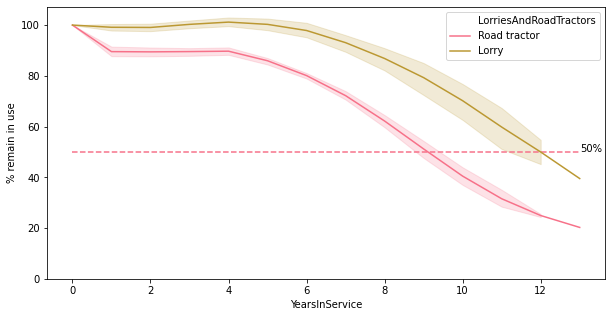
What is the service life of goods vehicles? Instead of directly answering it, we will tweak this question slightly and investigate how long it takes for half of the newly constructed to become de-registered.
The figure above presents the percentage of the goods vehicle that remains in use, to the number of years in service. A clear distinction is present between the analyzed vehicle types: 50% of the newly constructed road tractors become de-registered after being in use for 9 years; for lorries, that occurs 3 years later when they are in use for 12 years.
Why so many goods vehicles nowadays?
I always hear “it is a sign of booming economy” when talking to my Dutch fellows about the over crowded motorways. With this in mind, I looked into CBS data, in combination with GDP records from the World Bank.
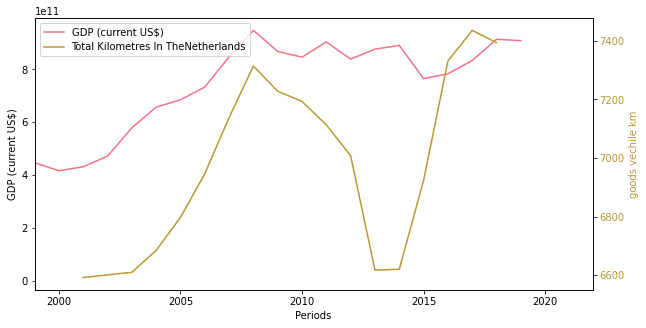
The chart above presents GPD (current USD)and goods vehicle km over the period from 2001 to 2018. A few observations can be made:
-
Vehicle km is highly correlated to economic growth: it increases during the economic boom and shrinks in the bust.
-
Road transport seems to lead the cycle. While freight transport recovery started in 2014, the economy entered the growth cycle one year later in 2015. Similarly, the traffic kilometers reached its peak one year earlier in 2017 while the economy peaked in 2018.
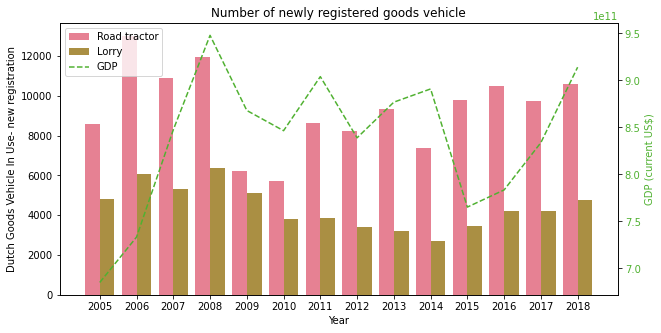
A similar trend can also be observed in the number of newly constructed or registered vehicles. During the years of 2009 and 2010, there is a significant reduction in the number of near construction. Investment in new vehicles started to recover from 2011 and returned to the pre-crisis level in 2015.
What I learned from the data
A few items can be learned from the exploratory data analysis,
-
The data contains information about two types of goods vehicle: lorries and road tractors;
-
Road tractor is gradually gaining popularity in recent years, with more road tractor entering the market than lorries;
-
Road tractors are more involved in extra-territory transportation than lorries while lorries tend to travel more often within the country.
-
Road tractors have larger annual kilometres than the lorries, both in and outside the Netherlands;
-
With regards to the life span, 50% of road tractors becomes de-registered after 9 years while for lorries that occurs after being in service for 12 years;
-
It is concluded that freight transport is highly dependent on the economy. The variation of the vehicle kilometers closely follows the economic cycle.
That is it for now. Next step: build a regression model to classify vehicle types.
All the used scripts are available in the git repo.
Reference
Vehicle kilometres of lorries and road tractors (Dutch and foreign vehicles) by territory, vehicle construction years, gross vehicle weight, CBS